https://experience.arcgis.com/experience/a258e36a5823484abb57b458b352fc4b

Use this dashboard to explore the Commonwealth’s progress towards achieving a resilient future. Within each sector, select a specific resilience goal to view a dropdown of the key strategies, progress indicators, and metrics tied to that goal’s advancement. A table with all available metrics can be expanded at the bottom of this section.
This beta version of the dashboard is still a work in progress. Some metrics are missing, as they are currently under development and will be reflected once the Commonwealth has sufficient information. This dashboard is maintained by the Executive Office of Energy and Environmental Affairs (EEA) and will be updated periodically to reflect progress in implementing these actions. The most recent update was in May 2025.
For more information on the ResilientMass Metrics framework, visit the ResilientMass Metrics website.
Related: Visit the ResilientMass Action Tracker to view the status of over 100 priority resilience actions being taken by state agencies to address statewide climate change impacts, as identified through development of the 2023 ResilientMass Plan.
Expand to View All Available Metrics

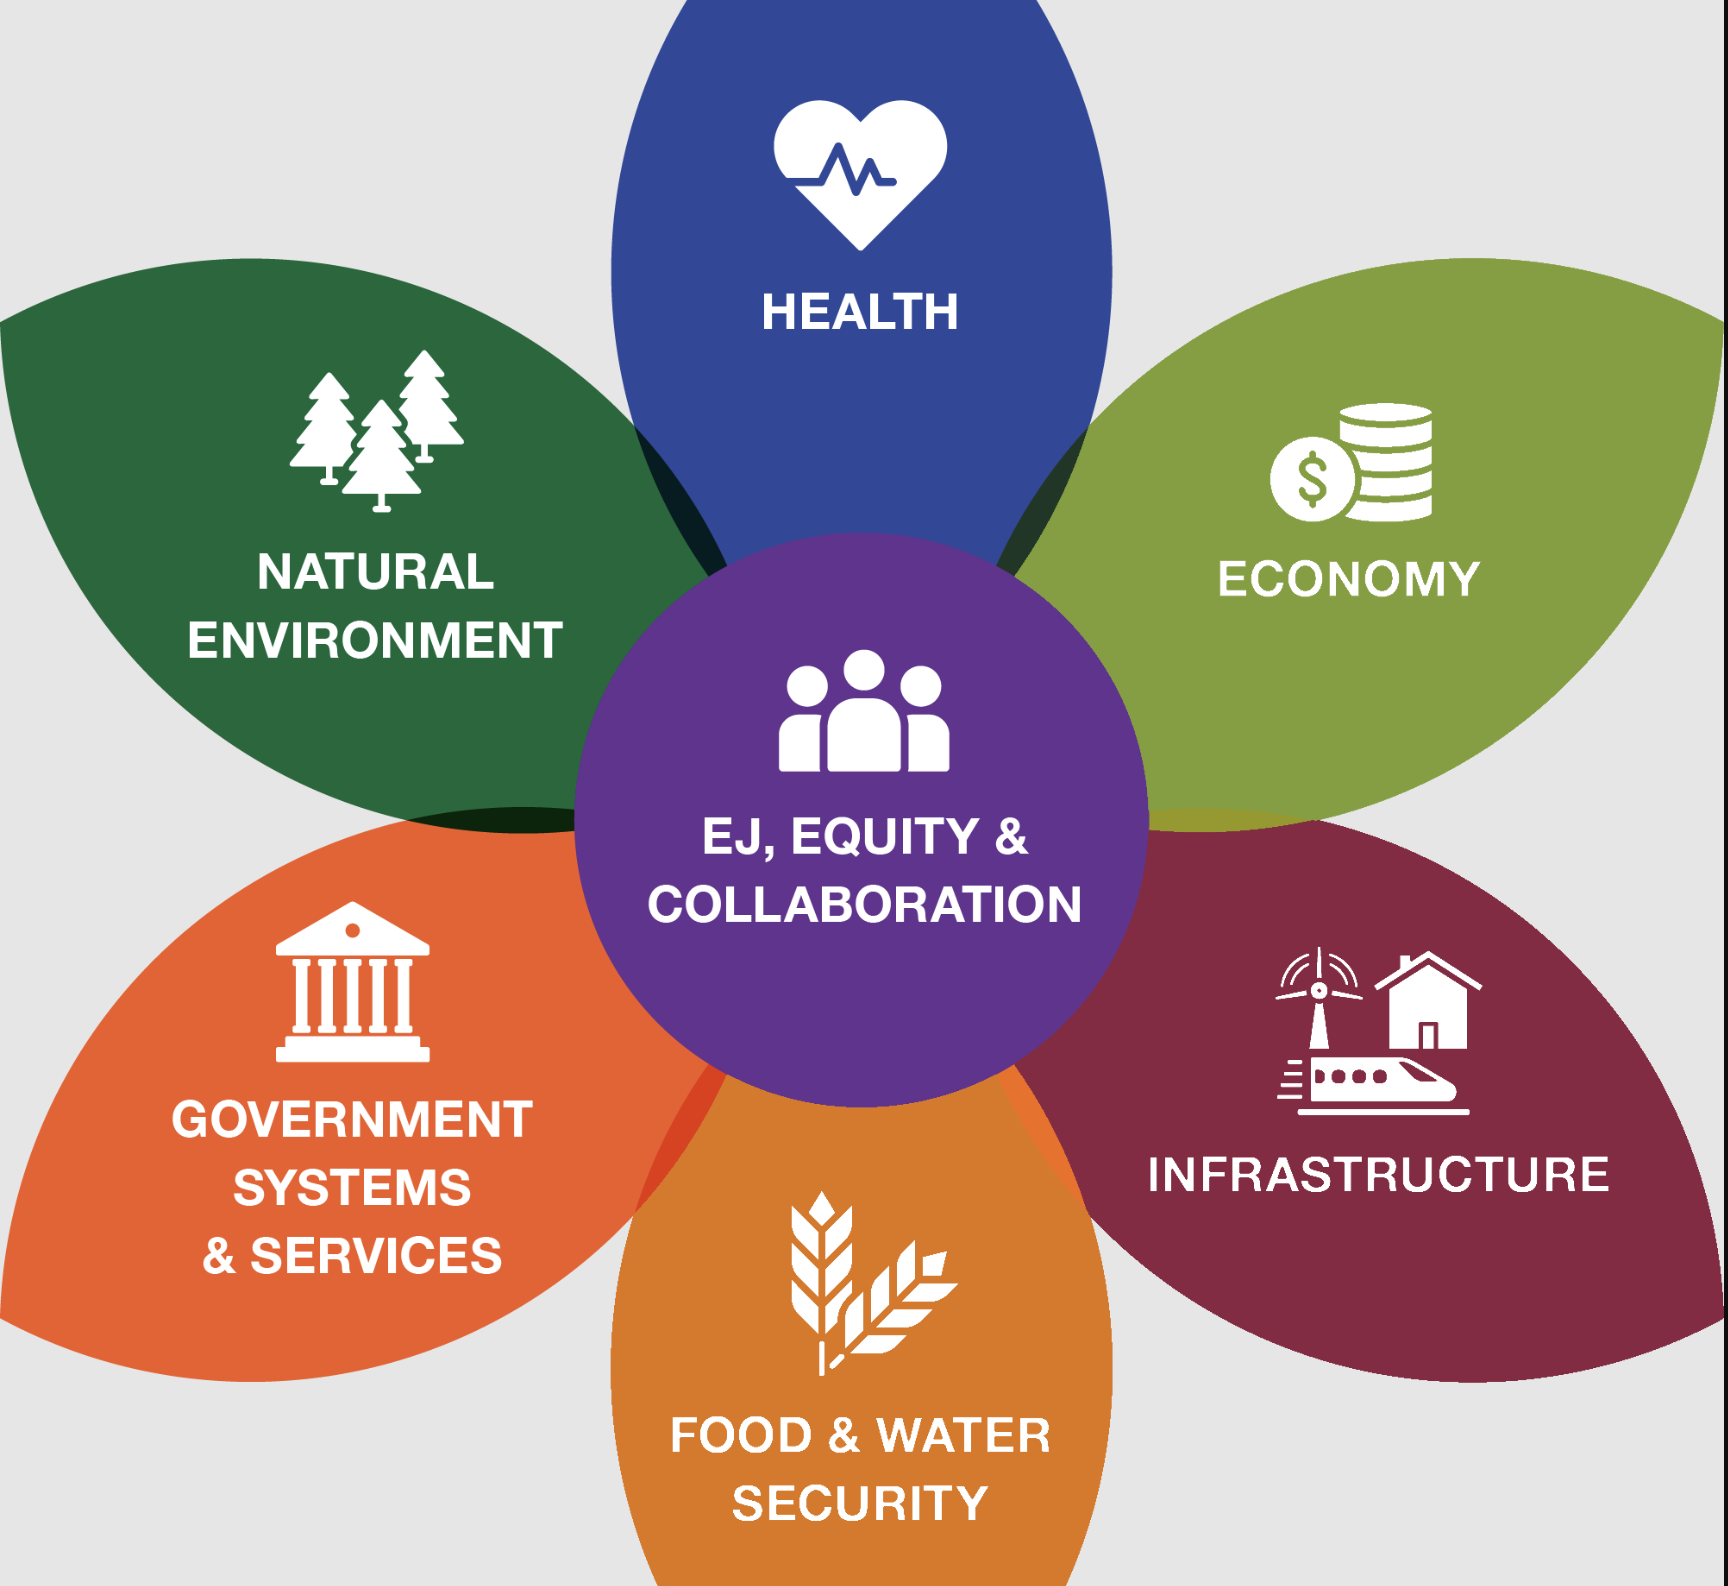
HEALTH
Both physical and mental health, despite growing climate extremes and long-term climate changes, are critical to the wellbeing of Massachusetts residents. Extreme heat, air quality worsened by climate warming, and delays in receiving emergency services due to extreme storms are of highest concern.
Review Health goals, strategies, indicators, and metrics below.
People are safe and healthy during extreme heat events

People are safe and healthy during and following coastal and inland flooding and windstorm events
People are safe and healthy during climate-driven air quality events
Mental health impacts related to climate change are minimized

ECONOMY
Many aspects of Massachusetts’ economy are sensitive to climate changes and disruptions from extreme events. They can lead, for example, to supply chain disruptions, reduced ability to work, particularly for outdoor workers during extreme heat or resulting from commute delays due to damaged infrastructure. Similarly, the MA Climate Assessment projects a decrease in marine fisheries and aquaculture productivity from changing ocean temperatures and acidification, which leads to decreased catch and revenues and impacts on related industries unless adaptation actions are taken.
Review Economy goals, strategies, indicators, and metrics below.
Local natural industries remain productive in the face of climate threats

Businesses experience limited disruption due to extreme events
Local workforces are skilled and trained to implement resilience projects and initiatives

INFRASTRUCTURE
There are many types of critical infrastructure in the state—for energy production, storage and transmission, for water and wastewater, for transportation by car and rail, for communication, for port operations, and housing. Some of these the state has direct control over in terms of planning, designing, maintaining and upgrading, while for others (for example, communication), private entities are in charge of many of these tasks, even though there is regulatory oversight from both federal and state government. Damage to transportation infrastructure, increased strain on energy systems, and impacts on water infrastructure are among the most urgent concerns related to climate change.
Review Infrastructure goals, strategies, indicators, and metrics below.
Infrastructure development minimizes impacts on the natural environment and incorporates nature-based solutions

Critical facilities are protected from flooding and other climate hazards
Ports experience minimal infrastructure damage and minimal closures due to sea level rise and other climate hazards
Public transit and rail networks face minimal disruptions from extreme climate events
Reliable and affordable communications infrastructure
Reliable and affordable electricity access
Roads and bridges remain accessible and safe for travel
Water and wastewater treatment infrastructure are resilient
Dams and culverts can manage the increasing pressures from a changing climate
People have access to housing that is safe from flooding and other climate hazards and is affordable
Communities are prepared to support new residents relocating to areas with fewer climate risks

FOOD & WATER SECURITY
Food security in the face of climate change is a relatively new focus for resilience building in Massachusetts, while ensuring water security is a long-standing focus even as climate change makes maintaining sufficient and clean water more challenging.
Review Food & Water Security goals, strategies, indicators, and metrics below.
Food distribution networks provide uninterrupted access to healthy foods

People have access to safe and affordable drinking water via wells or public water supply in face of potential drought or water quality issues
Local food production provides reliable access to healthy foods

GOVERNMENT SYSTEMS & SERVICES
Well-functioning government systems and services—ranging from the provision of information and infrastructure, to planning, emergency preparedness and disaster response—are important for a resilient Commonwealth. The effective functioning of these services is mostly invisible in daily life but becomes essential in case of and after emergencies. Priority impacts from climate change identified in the Massachusetts Climate Change Assessment include a reduction in state and municipal revenues, increased costs of responding to climate migration, and increased demand for state and municipal government services such as emergency response, food assistance, and health care.
Review Government Systems and Services goals, strategies, indicators, and metrics below.
The government is able to minimize interruptions to the services it provides

The government has enough capacity to meet the increase in demand caused by climate stressors
State-owned buildings, facilities, and assets are resilient to climate hazards
State revenue streams remain stable through climate impacts
Emergency planning at the state and municipal level accounts for climate change-driven extremes
Emergency service providers are able to respond in a timely manner and people are able to safely evacuate during climate events

NATURAL ENVIRONMENT
Massachusetts has a rich natural environment. The 2022 Massachusetts Climate Change Assessment identified several priority climate impacts on the natural environment sector. Among the most urgent are freshwater ecosystem degradation, marine ecosystem degradation, and coastal wetland degradation. Freshwater ecosystem degradation is expected to occur due to warming waters, drought, and increased runoff. These can lead to changes in water quality, habitat loss, and shifts in species composition. Marine ecosystem degradation is primarily driven by ocean warming, particularly in the Gulf of Maine, and by ocean acidification. These changes can affect marine biodiversity, alter food webs, and impact commercially important fish species. Coastal wetland degradation is also projected to result from sea level rise and storm surge. These threaten habitats such as wetlands and dunes, which are vital for numerous bird and fish species and serve as important natural defenses against coastal flooding. In general, the metrics developed through ResilientMass Metrics are focused on urban, coastal and marine, freshwater, and forest habitats. For each of these different types of habitats, the set of metrics were developed in a comparable way, looking at the amount and the quality of these habitats, the ability of these ecosystems to provide certain benefits to society, and for everyone to have equal access to them.
Review Natural Environment goals, strategies, indicators, and metrics below.
Everyone has safe and easy access to public green space, tree cover, aquatic recreational areas, and natural open space

Freshwater ecosystems are resilient to rising temperatures and changing precipitation patterns
Marine and coastal ecosystems are resilient to sea level rise and the effects of increased temperatures, precipitation, and storms
Forests and other native inland ecosystems are resilient and maintain biodiversity despite increasing pests, storms, and wildfires

EJ, EQUITY & COLLABORATION
Massachusetts has made a cross-government commitment to centering equity and increasing equitable outcomes for environmental justice (EJ) and other priority populations. While all sectors aim to measure whether progress towards goals is happening equitably, the EJ, Equity, and Collaboration category focuses on topics such as engagement, relationship building, avoiding unintended consequences, and reducing inequalities in the impacts of climate change.
Review EJ, Equity, and Collaboration goals, strategies, indicators and metrics below.
Environmental Justice populations, Indigenous peoples, and other priority populations are meaningfully involved in resilience planning

Strong community relationships and organizational networks provide resources and support
State, Tribal, and local partnerships create a diverse network with robust capacity

Climate resilience funding, and the benefits of climate resilience investment, is equitably distributed
Climate resilience solutions are based on science and Traditional Ecological Knowledge or Indigenous Knowledge

Climate resilience solutions seek restorative justice to address past disproportionate burdens
The inequitable distribution of climate impacts is reduced
Climate resilience actions and investments avoid negative unintended consequences
Leave a Reply